03818CHINA DONGXIANG
0.3900.010+2.63%5.59M2.15M0.3750.3800.3950.3752.30B2.30B5.89B5.89B+9.86%+9.86%-3.70%+18.18%+14.77%+14.98%+11.43%5.38%0.10%LossLoss5.26%Apparel Manufacturing
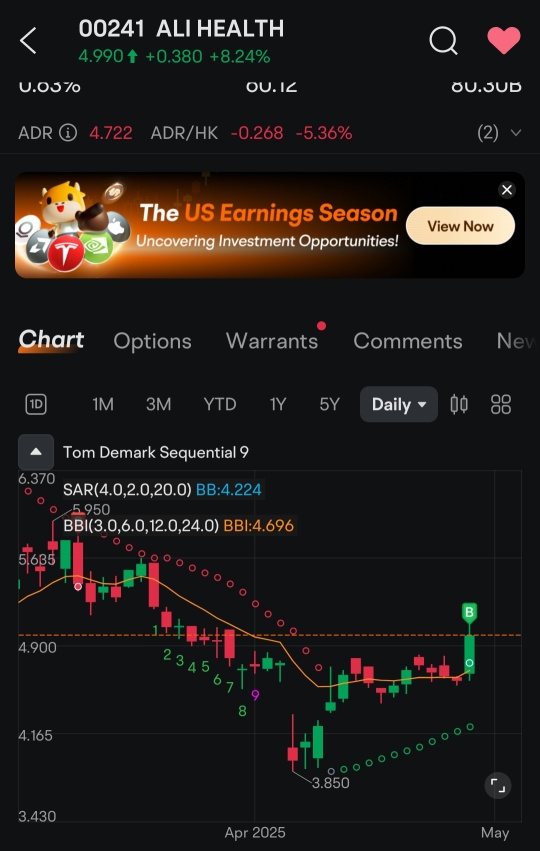
00241ALI HEALTH
5.0400.100+2.02%106.52M538.42M4.9504.9405.1804.92081.11B81.11B16.09B16.09B+6.33%+7.92%+5.00%+39.61%+28.24%+89.47%+51.81%--0.66%60.7282.625.26%Pharmaceutical Distribution
00656FOSUN INTL
4.0300.070+1.77%1.83M7.31M3.9603.9604.0303.95032.97B32.97B8.18B8.18B+0.50%-1.47%-6.93%-5.18%-8.62%-4.77%-11.23%0.94%0.02%LossLoss2.02%Conglomerates
00980LIANHUA
0.3450.005+1.47%1.46M503.14K0.3650.3400.3650.340510.46M128.55M1.48B372.60M+1.47%-1.43%-6.76%-12.66%-13.75%+73.37%+6.15%--0.39%LossLoss7.35%Supermarkets & Convenience Stores
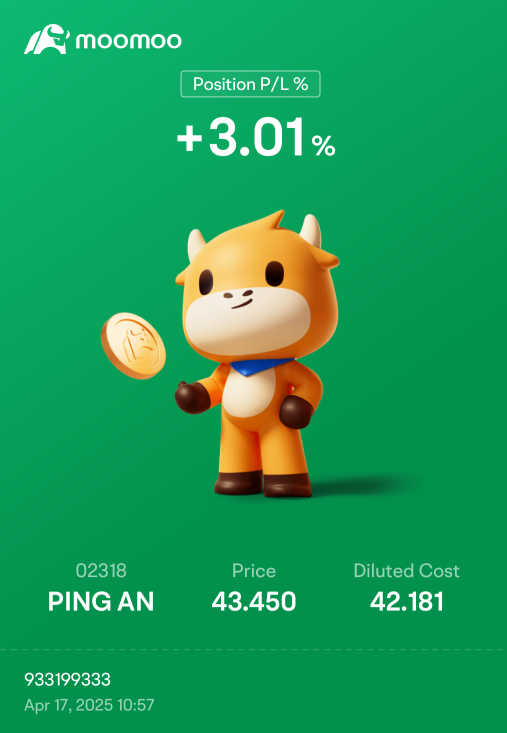
02318PING AN
46.3500.200+0.43%20.62M958.92M46.30046.15046.80046.150844.04B345.20B18.21B7.45B+1.76%+5.82%-1.28%+6.31%-3.74%+57.75%+0.65%5.75%0.28%6.666.171.41%Insurance
02048E-HOUSE ENT
0.1580.0000.00%218.70K33.61K0.1540.1580.1600.153276.35M276.35M1.75B1.75B-9.20%-1.25%-20.60%+41.07%-20.60%+167.80%+23.44%--0.01%LossLoss4.43%Real Estate Services
01060ALI PICTURES
0.5000.0000.00%61.81M30.66M0.5000.5000.5100.49014.94B14.94B29.88B29.88B0.00%0.00%-7.41%-5.66%+3.09%+19.05%+5.26%--0.21%83.3345.454.00%Entertainment
03908CICC
13.320-0.060-0.45%10.38M138.55M13.42013.38013.48013.24064.30B25.36B4.83B1.90B-3.76%-3.48%-11.08%+3.58%-5.01%+60.20%+3.90%2.21%0.55%9.1310.461.79%Securities & Brokerage
06808SUNART RETAIL
1.830-0.010-0.54%503.50K926.93K1.8301.8401.8501.83017.46B17.46B9.54B9.54B-4.69%-3.68%-3.17%+7.65%-13.68%+25.34%-26.21%10.38%0.01%LossLoss1.09%Supermarkets & Convenience Stores
08279AGTECH HOLDINGS
0.202-0.006-2.88%200.00K40.40K0.2020.2080.2020.2022.36B2.36B11.67B11.67B+1.51%+2.02%+1.00%+2.54%+3.59%-3.81%+1.00%--0.00%67.33Loss0.00%Payment services
01428BRIGHT SMART
6.750-0.550-7.53%273.59M1.95B7.2607.3007.8306.32011.46B11.46B1.70B1.70B+150.00%+170.00%+140.21%+190.95%+198.67%+467.23%+196.05%4.89%16.12%19.3420.5220.69%Securities & Brokerage
00376YUNFENG FIN
1.340-0.140-9.46%4.10M5.71M1.4701.4801.4701.3305.18B5.18B3.87B3.87B+42.55%+32.67%+17.54%+26.42%+19.64%+55.81%+28.85%--0.11%10.9810.989.46%Insurance