KTOSKratos Defense & Security Solutions
34.4200.920+2.75%1.58M54.22M33.50033.50034.52533.5005.28B5.14B153.29M149.42M+7.16%+4.35%+15.93%+3.15%+50.50%+84.46%+30.48%--1.06%312.91312.913.06%Aerospace & Defense
ATROAstronics
22.6400.590+2.68%242.57K5.44M22.04022.05022.66022.000802.58M699.58M35.45M30.90M+13.03%-0.75%-6.33%+27.91%+27.84%+35.89%+41.85%--0.79%LossLoss2.99%Aerospace & Defense
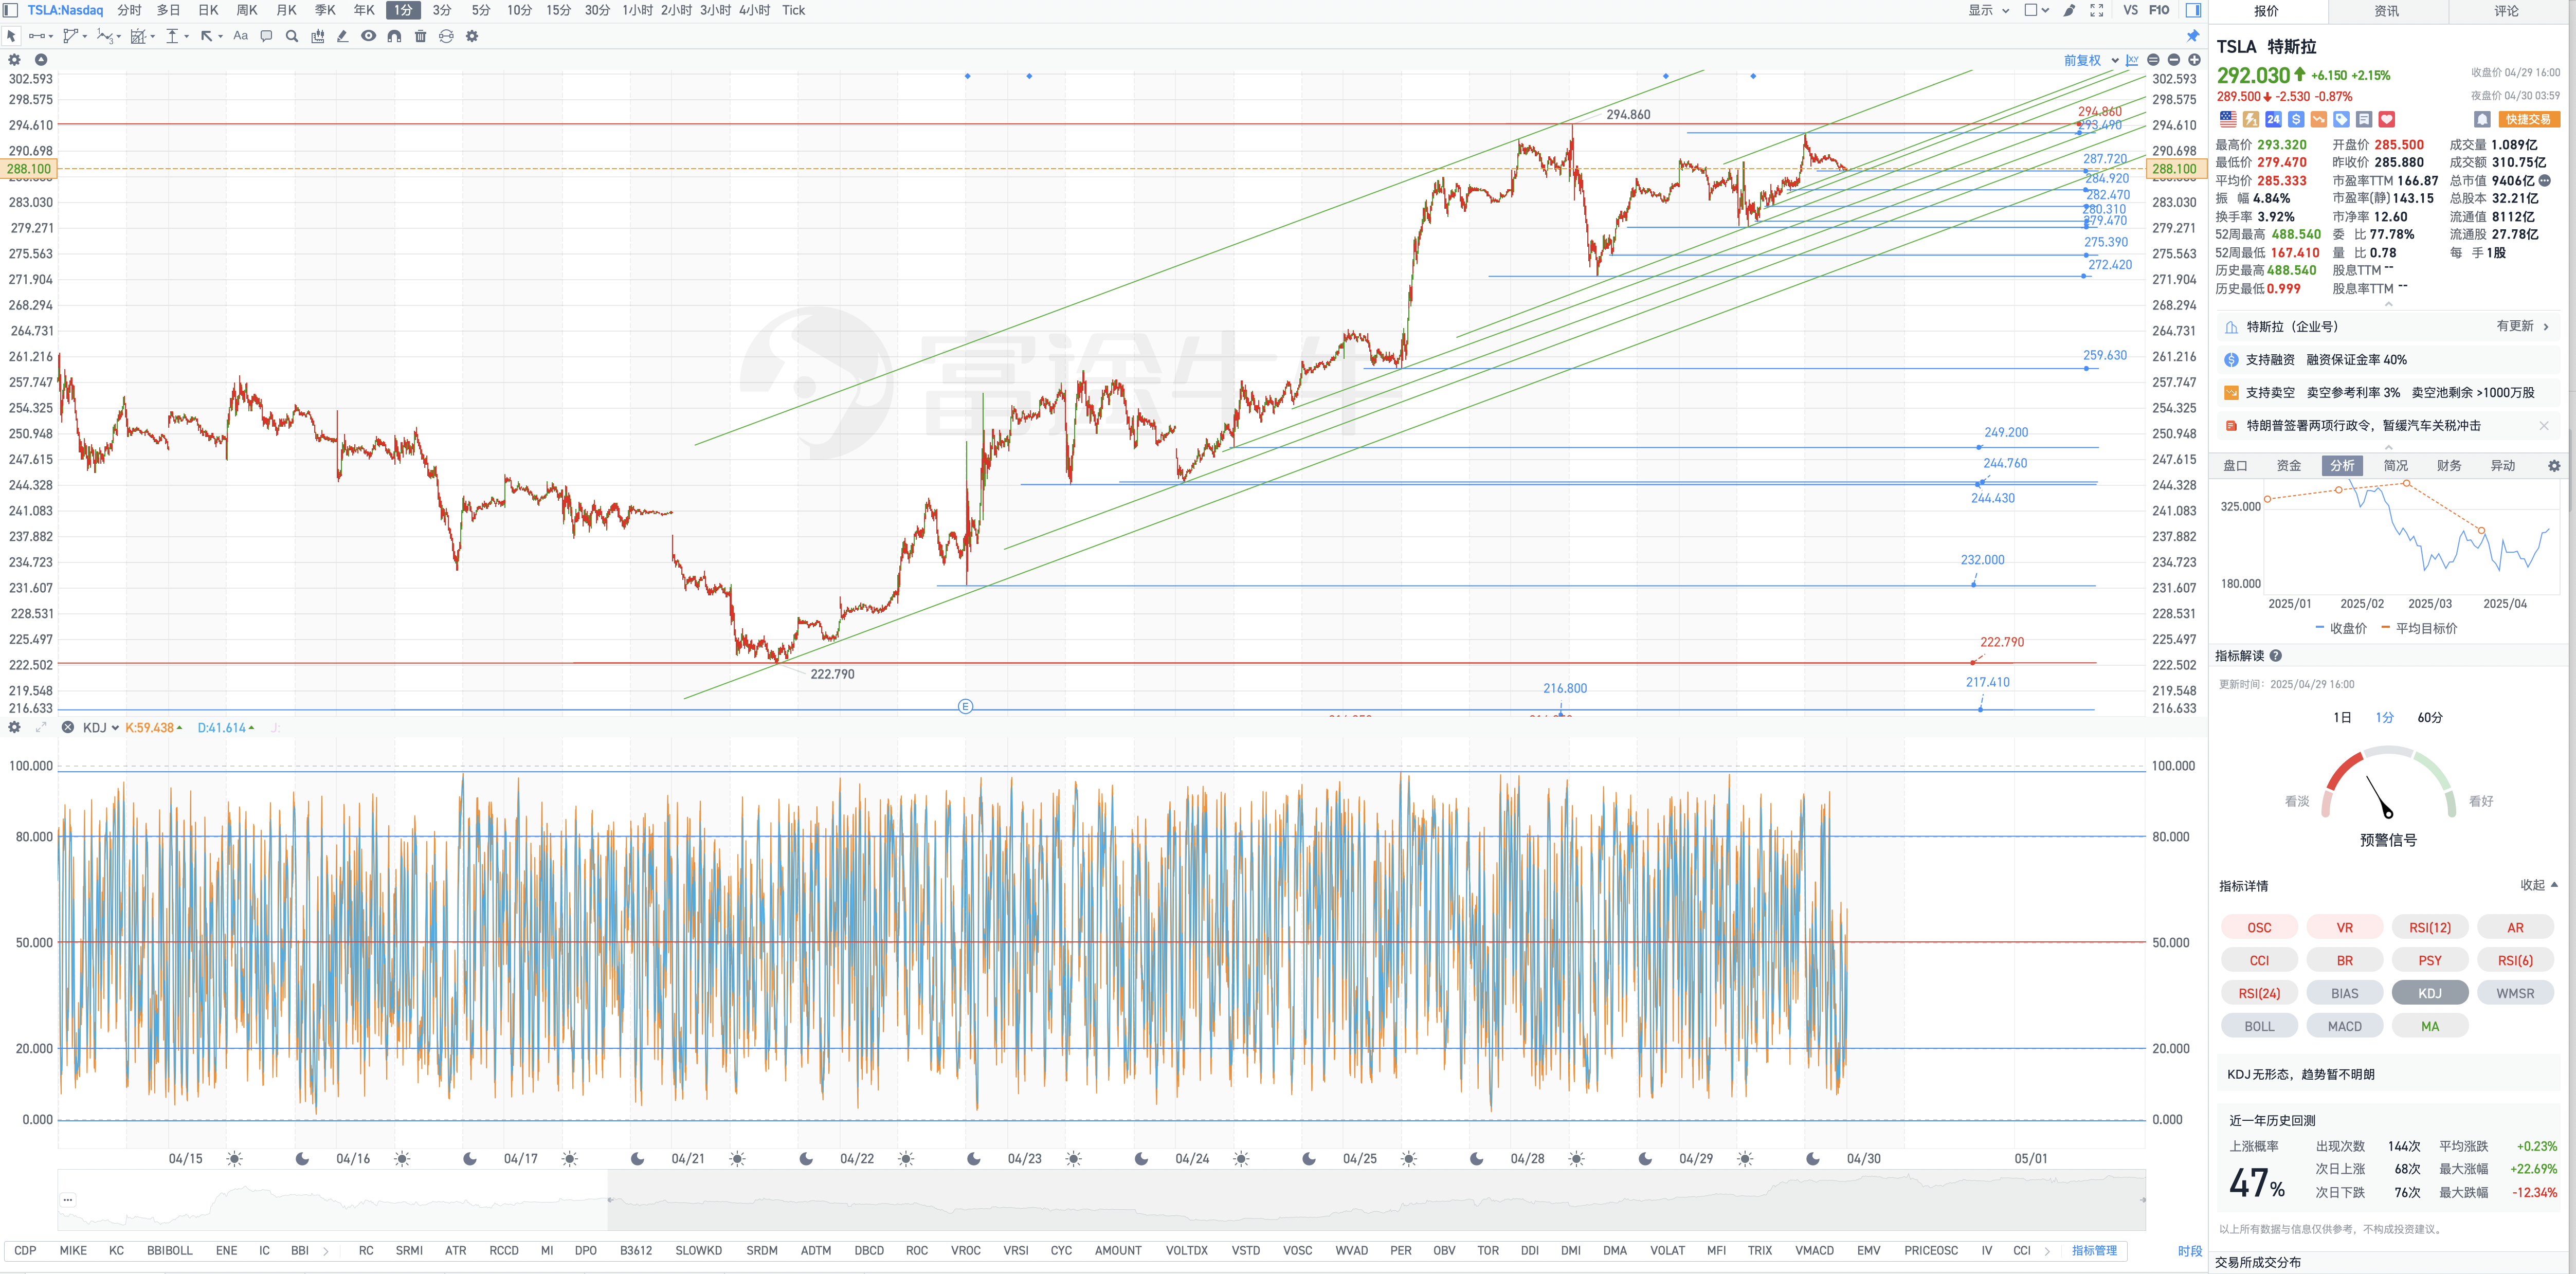
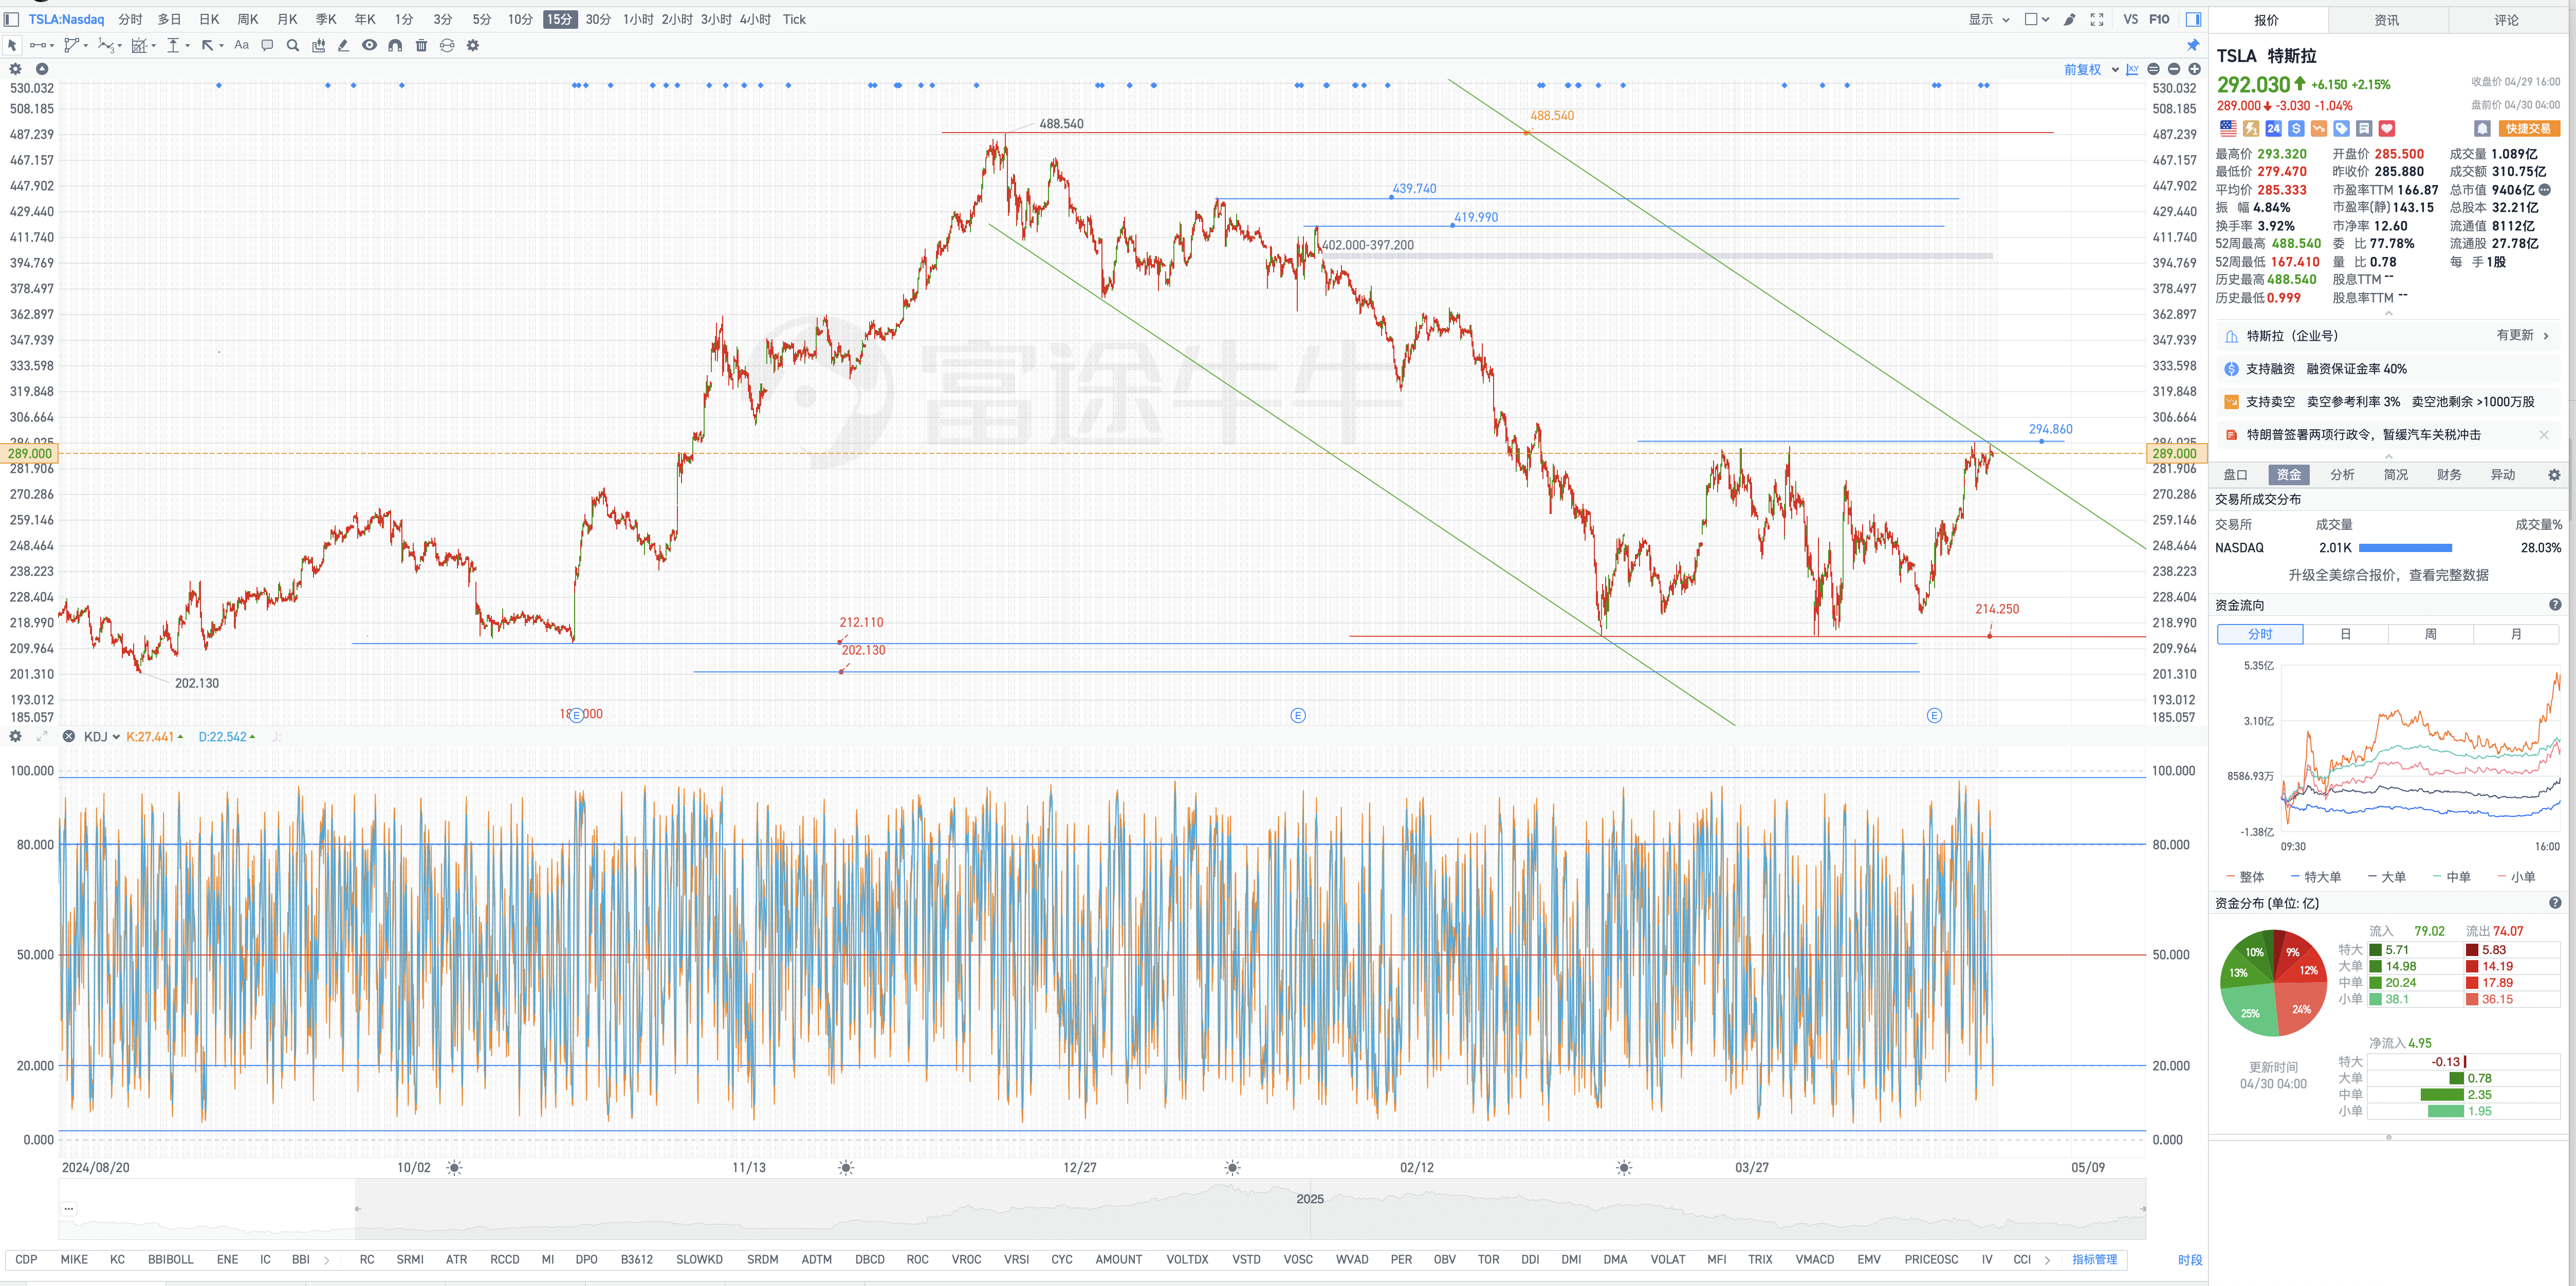
TSLATesla
292.0306.150+2.15%108.91M31.07B285.500285.880293.320279.470940.62B811.16B3.22B2.78B+22.72%+15.72%+12.68%-27.82%+17.29%+50.49%-27.69%--3.92%166.87143.154.85%Auto Manufacturers
LHXL3Harris Technologies
221.2302.470+1.13%1.27M281.55M218.110218.760222.290217.49041.36B41.18B186.95M186.13M+2.86%-0.66%+5.69%+4.92%-9.69%+4.01%+5.78%2.12%0.68%26.2428.112.19%Aerospace & Defense
HEIHeico
249.8702.470+1.00%374.86K93.52M249.010247.400251.390247.03034.72B29.53B138.95M118.20M+3.69%-1.66%-6.48%+4.57%+1.68%+20.49%+5.15%0.09%0.32%61.7068.081.76%Aerospace & Defense
BKSYBlackSky Technology
8.6300.080+0.94%435.74K3.72M8.5808.5508.6508.360273.16M224.76M31.65M26.04M+25.80%+18.71%+11.64%-42.43%+25.25%-14.38%-20.02%--1.67%LossLoss3.39%Scientific & Technical Instruments
HWMHowmet Aerospace
137.5001.150+0.84%2.45M337.08M136.000136.350138.410135.75055.61B54.96B404.46M399.68M+10.62%+7.88%+5.99%+8.71%+37.66%+105.50%+25.82%0.19%0.61%48.9348.931.95%Aerospace & Defense
RTXRTX Corp
125.7300.930+0.75%4.31M541.09M124.800124.800126.035124.390167.97B152.96B1.34B1.22B+10.53%-2.64%-5.08%-2.00%+6.98%+25.43%+9.20%2.00%0.36%36.8735.421.32%Aerospace & Defense
AIRAAR Corp
53.8800.390+0.73%272.52K14.66M53.39053.49054.18853.3901.95B1.90B36.10M35.26M+5.83%-0.61%-3.77%-20.48%-7.74%-22.15%-12.08%--0.77%Loss41.771.49%Aerospace & Defense
PLPlanet Labs PBC
3.4300.020+0.59%2.23M7.66M3.4503.4103.4803.3601.04B766.72M302.25M223.53M+12.83%+9.24%+1.48%-43.77%+51.10%+97.13%-15.10%--1.00%LossLoss3.52%Aerospace & Defense
RDWRedwire
11.2300.040+0.36%721.37K8.01M11.22011.19011.34010.840865.63M373.78M77.08M33.28M+19.09%+23.68%+35.46%-53.05%+44.72%+195.53%-31.77%--2.17%LossLoss4.47%Aerospace & Defense
LUNRIntuitive Machines
8.6000.030+0.35%3.56M30.48M8.5558.5708.6908.445995.24M939.55M115.73M109.25M+16.85%+11.25%+15.44%-60.33%+6.04%+56.08%-52.64%--3.25%LossLoss2.86%Aerospace & Defense
SATSEchoStar
22.7000.020+0.09%904.21K20.58M22.52022.68023.04022.4006.50B3.03B286.55M133.57M+6.52%-0.18%-11.26%-17.93%-8.02%+41.88%-0.87%--0.68%LossLoss2.82%Communication Equipment
VSATViasat
9.3700.0000.00%1.30M12.27M9.3509.3709.5659.2601.21B978.87M129.12M104.47M+14.83%+11.61%-10.08%-2.60%-1.37%-43.04%+10.11%--1.25%LossLoss3.26%Communication Equipment
LMTLockheed Martin
475.880-0.410-0.09%897.22K426.79M475.980476.290479.300473.350111.50B82.84B234.30M174.08M+2.99%+0.11%+6.53%+3.55%-11.54%+4.45%-1.35%2.71%0.52%20.5121.331.25%Aerospace & Defense
TDYTeledyne Technologies
462.620-0.420-0.09%266.99K123.45M461.880463.040465.460456.22021.68B21.43B46.86M46.32M+0.33%-0.90%-7.05%-9.53%+1.63%+20.82%-0.33%--0.58%26.4726.882.00%Scientific & Technical Instruments
GSATGlobalstar
19.670-0.030-0.15%293.31K5.77M19.63019.70019.92019.4302.49B982.50M126.58M49.95M+3.58%+0.67%-5.70%-14.29%-4.98%+0.87%-36.65%--0.59%LossLoss2.49%Telecom Services
BABoeing
182.000-0.300-0.16%6.80M1.24B182.520182.300184.250181.200137.23B126.92B754.01M697.36M+11.99%+14.26%+6.71%+3.10%+17.73%+4.91%+2.82%--0.97%LossLoss1.67%Aerospace & Defense
IRDMIridium Communications
24.120-0.040-0.17%1.31M31.42M24.20024.16024.55023.7652.61B2.29B108.16M95.05M+11.61%-0.82%-11.71%-15.68%-16.90%-22.60%-16.46%2.32%1.37%22.9725.663.25%Telecom Services
NOCNorthrop Grumman
482.100-1.210-0.25%977.36K471.91M483.790483.310487.115480.00069.39B65.16B143.93M135.15M+3.88%-10.03%-5.84%-0.62%-4.07%+0.86%+3.19%1.71%0.72%19.0317.011.47%Aerospace & Defense
DXYZDestiny Tech100
37.990-0.200-0.52%270.10K10.18M37.97038.19038.31036.835413.33M413.33M10.88M10.88M+24.93%+13.54%+7.35%-30.52%+239.80%+120.23%-35.46%--2.48%23.7123.713.86%Asset Management
RKLBRocket Lab
22.400-0.270-1.19%6.65M149.73M22.83022.67023.00022.30010.16B8.95B453.55M399.44M+17.65%+17.09%+25.28%-22.89%+96.15%+489.47%-12.05%--1.66%LossLoss3.09%Aerospace & Defense
ASTSAST SpaceMobile
23.900-0.350-1.44%3.71M89.37M24.21024.25024.44023.7905.70B4.54B238.45M189.78M+12.21%+4.32%+5.10%+18.08%+0.21%+925.75%+13.27%--1.96%LossLoss2.68%Communication Equipment
MNTSMomentus
1.850-0.030-1.60%41.87K77.65K1.8901.8801.9491.8109.73M8.87M5.26M4.79M+5.71%-7.50%-7.50%-68.27%-76.69%-72.97%-76.67%--0.87%LossLoss7.38%Aerospace & Defense
TSATTelesat
15.800-0.260-1.62%70.50K1.12M15.76016.06016.16515.420224.25M208.49M14.19M13.20M-0.13%-8.06%-16.09%-14.27%+25.40%+121.29%-3.89%--0.53%LossLoss4.64%Communication Equipment
SIDUSidus Space
1.570-0.030-1.88%138.18K219.35K1.5801.6001.6151.56028.74M28.37M18.30M18.07M+9.03%+13.77%+6.08%-36.69%-32.62%-54.23%-67.96%--0.77%LossLoss3.44%Aerospace & Defense
SPCEVirgin Galactic
2.970-0.080-2.62%1.10M3.29M3.0703.0503.1002.935121.23M116.32M40.82M39.17M+16.02%+14.23%-1.98%-37.61%-55.07%-83.20%-49.49%--2.81%LossLoss5.41%Aerospace & Defense
KULRKULR Technology
1.280-0.090-6.57%5.89M7.72M1.3501.3701.3601.271364.02M316.54M284.39M247.30M+3.23%-1.54%-3.03%-38.46%+357.96%+173.04%-63.94%--2.38%LossLoss6.49%Electronic Components
SPIRSpire Global
9.720-0.760-7.25%1.25M12.13M10.49010.48010.6539.355301.00M274.95M30.97M28.29M+12.24%+5.65%+20.15%-43.32%-9.16%-6.36%-30.92%--4.41%LossLoss12.38%Specialty Business Services