WFCWells Fargo & Co
71.1001.670+2.41%24.56M1.73B68.95069.43071.34068.950231.37B231.35B3.25B3.25B+7.35%+12.68%-0.96%-9.33%+11.11%+21.79%+1.72%2.18%0.76%12.7913.243.44%Banks - Diversified
NTRSNorthern Trust
94.0501.540+1.66%1.26M117.54M92.01092.51094.30092.01018.30B18.02B194.54M191.57M+5.25%+4.72%-4.66%-15.58%-4.49%+16.24%-7.52%3.19%0.66%8.789.632.48%Asset Management
BKBank of New York Mellon
80.0401.130+1.43%3.14M250.72M78.75078.91080.36078.56057.26B57.12B715.43M713.62M+4.89%+3.89%-3.98%-6.28%+7.53%+43.20%+5.40%2.29%0.44%13.0613.802.28%Banks - Diversified
SCHWCharles Schwab
81.2601.080+1.35%7.78M629.12M80.21080.18081.46579.610147.56B135.89B1.82B1.67B+6.11%+5.64%+3.81%-1.44%+15.32%+10.52%+10.16%1.26%0.47%24.6227.182.31%Capital Markets
AMGAffiliated Managers
165.2302.070+1.27%140.78K23.17M162.190163.160165.710161.5014.83B4.77B29.26M28.85M+4.26%+4.23%-1.67%-12.08%-14.74%+4.00%-10.64%0.02%0.49%10.9210.922.58%Asset Management
FITBFifth Third Bancorp
36.1600.415+1.16%3.62M130.42M35.64035.74536.29035.50524.13B23.95B667.27M662.35M+4.36%+4.51%-7.76%-17.61%-14.63%+1.39%-13.65%4.04%0.55%11.4811.522.20%Banks - Regional
STTState Street
88.5300.960+1.10%2.12M186.80M87.21087.57088.68087.00025.56B24.14B288.68M272.68M+5.59%+9.42%-0.27%-12.14%-3.03%+23.83%-8.32%3.35%0.78%9.9710.781.92%Asset Management
PFGPrincipal Financial
74.5900.720+0.97%1.63M121.02M73.38073.87074.90573.38016.78B16.67B225.00M223.54M+2.39%+1.58%-11.59%-8.71%-7.63%-3.95%-2.76%3.90%0.73%15.9711.172.06%Asset Management
VTRVentas Inc
69.1400.640+0.93%2.56M176.76M68.50068.50069.69068.47530.26B30.12B437.70M435.58M+1.24%+2.58%+0.55%+15.24%+9.31%+59.59%+18.23%2.60%0.59%363.89363.891.77%REIT - Healthcare Facilities
CCitigroup
68.8800.600+0.88%8.86M608.99M68.03068.28069.11067.970128.65B126.09B1.87B1.83B+6.71%+8.95%-2.97%-14.83%+9.83%+14.45%-1.47%3.21%0.48%10.8811.581.67%Banks - Diversified
USBU.S. Bancorp
40.5000.320+0.80%8.39M338.49M39.95040.18040.56539.76063.18B62.99B1.56B1.56B+3.85%+6.02%-4.07%-14.22%-13.43%+2.68%-14.31%4.91%0.54%10.0210.692.00%Banks - Regional
INTUIntuit
623.1504.920+0.80%843.52K524.64M618.680618.230624.190616.080174.21B169.96B279.56M272.75M+6.78%+4.99%+1.67%+3.78%+0.57%-1.75%-0.51%0.62%0.31%58.2959.751.31%Software - Application
BLKBlackrock
920.5206.780+0.74%392.42K359.94M910.890913.740921.700905.045142.68B133.03B155.00M144.52M+3.75%+3.44%-2.74%-13.94%-5.58%+23.71%-9.71%2.23%0.27%22.3621.911.82%Asset Management
ZIONZions Bancorp
45.2600.320+0.71%1.49M67.00M44.66044.94045.39044.0606.68B6.54B147.57M144.43M+4.94%+5.50%-9.23%-21.17%-10.69%+13.24%-15.92%3.71%1.03%8.849.142.96%Banks - Regional
MTBM&T Bank
169.9101.190+0.71%722.58K122.44M167.710168.720170.520167.12527.62B27.48B162.55M161.72M+4.88%+7.20%-4.95%-14.97%-10.44%+20.32%-8.99%3.18%0.45%11.3711.612.01%Banks - Regional
AMPAmeriprise Financial
471.6503.270+0.70%524.64K245.97M464.300468.380472.150460.53045.04B44.89B95.50M95.19M+0.86%-0.59%-2.57%-12.96%-6.48%+14.75%-11.17%1.26%0.55%16.0314.272.48%Asset Management
PNCPNC Financial Services
160.6000.950+0.60%1.64M263.57M158.690159.650161.370158.36563.56B63.05B395.79M392.62M+3.98%+4.48%-7.68%-19.25%-12.58%+6.92%-15.16%3.95%0.42%11.3511.691.88%Banks - Regional
JPMJPMorgan
244.6201.400+0.58%7.22M1.76B242.190243.220245.250241.690679.82B676.22B2.78B2.76B+3.83%+4.22%+0.34%-7.92%+10.97%+29.50%+3.21%2.06%0.26%12.0012.391.46%Banks - Diversified
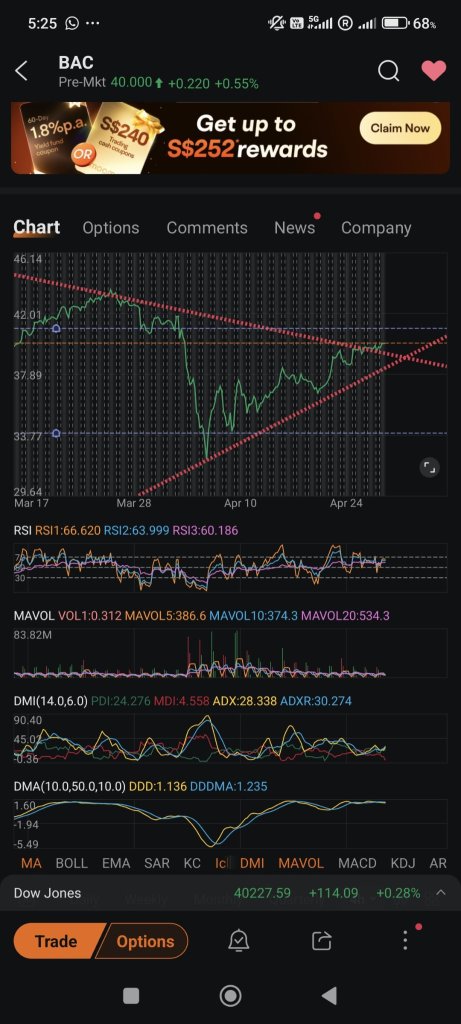
BACBank of America
39.9900.210+0.53%33.79M1.35B39.63039.78040.14039.480302.33B301.35B7.56B7.54B+4.36%+9.05%-4.17%-13.08%-3.10%+9.13%-8.44%2.55%0.45%11.9412.461.66%Banks - Diversified
AIVApartment Investment & Management
7.8100.040+0.51%663.45K5.17M7.7207.7707.8317.7201.11B958.30M141.97M122.70M+0.51%+1.43%-11.25%-13.61%+0.45%+3.82%-7.94%--0.54%LossLoss1.43%REIT - Residential
KEYKeyCorp
14.9400.070+0.47%9.76M145.36M14.78014.87015.04014.65016.61B16.54B1.11B1.11B+5.43%+6.26%-6.57%-15.89%-11.07%+6.56%-11.77%5.49%0.88%LossLoss2.62%Banks - Regional
GSGoldman Sachs
548.9202.520+0.46%1.70M928.92M543.790546.400550.880541.300170.60B169.54B310.79M308.86M+5.56%+8.92%+0.48%-13.86%+6.74%+30.23%-3.66%2.14%0.55%12.7413.541.75%Capital Markets
HBANHuntington Bancshares
14.6400.060+0.41%13.69M199.84M14.51014.58014.68014.39021.33B21.16B1.46B1.45B+5.10%+11.33%-2.47%-13.99%-3.55%+12.61%-9.07%4.23%0.95%11.2612.001.99%Banks - Regional
MSMorgan Stanley
116.2100.380+0.33%4.69M543.29M115.380115.830116.465114.230186.75B142.37B1.61B1.23B+5.28%+6.51%-0.39%-16.05%+0.11%+29.16%-6.95%3.12%0.38%13.6214.621.93%Capital Markets
RFRegions Financial
20.5200.060+0.29%5.58M114.22M20.33020.46020.56520.18518.45B18.36B899.00M894.75M+3.74%+6.49%-5.57%-15.83%-11.16%+8.91%-11.83%4.82%0.62%9.9110.631.86%Banks - Regional
TROWT. Rowe Price
88.8600.130+0.15%1.56M138.65M88.56088.73089.37587.76019.75B19.30B222.24M217.19M+3.11%-0.52%-3.28%-22.94%-18.76%-16.92%-20.33%5.58%0.72%9.719.711.82%Asset Management
IVZInvesco
13.9600.020+0.14%3.29M45.81M13.85013.94013.99513.7956.25B4.68B447.56M335.03M+3.48%+7.63%-7.98%-26.59%-19.67%+1.32%-19.24%5.87%0.98%11.1711.831.44%Asset Management
BENFranklin Resources
18.7500.020+0.11%2.97M55.41M18.65018.73018.78018.5509.85B5.82B525.40M310.28M+3.88%+3.82%-2.60%-14.27%-7.07%-14.74%-6.03%6.67%0.96%29.3022.061.23%Asset Management
AIGAmerican International Group
82.0000.070+0.09%3.33M273.44M81.58081.93082.54681.58047.87B47.67B583.77M581.31M+0.44%+0.61%-5.68%+11.86%+9.42%+10.59%+13.18%1.90%0.57%LossLoss1.18%Insurance - Diversified
COFCapital One Financial
183.080-0.050-0.03%2.60M475.67M183.100183.130183.910180.05070.12B67.81B383.00M370.38M+7.57%+12.65%+2.11%-9.86%+12.40%+27.72%+2.97%1.31%0.70%15.3715.802.11%Credit Services