FOURShift4 Payments
89.86010.200+12.80%4.28M380.20M88.00079.66090.64586.0006.18B5.31B68.82M59.10M+16.70%+17.46%+9.97%-25.02%-0.76%+50.37%-13.41%--7.24%30.7729.665.83%Software - Infrastructure
MQMarqeta
4.1200.150+3.78%3.24M13.19M3.9703.9704.1403.9701.94B1.70B470.28M412.70M+7.85%+5.10%0.00%+7.01%-29.57%-26.03%+8.71%--0.78%82.4082.404.28%Software - Infrastructure
GPNGlobal Payments
76.6302.320+3.12%3.01M228.89M74.82074.31076.78074.03018.84B18.69B245.88M243.84M+7.34%-9.91%-21.74%-31.91%-26.27%-37.93%-31.43%1.30%1.23%12.4412.443.70%Specialty Business Services
EEFTEuronet Worldwide
100.9302.600+2.64%460.32K46.07M97.78098.330101.45097.4504.36B4.08B43.23M40.43M+7.03%+5.43%-5.54%+2.47%+2.53%-3.55%-1.86%--1.14%14.9515.654.07%Software - Infrastructure
AFRMAffirm Holdings
50.4001.230+2.50%7.38M373.83M50.10049.17052.99049.57016.03B13.02B318.06M258.35M+15.02%+23.59%+11.53%-17.47%+16.61%+50.81%-17.24%--2.86%LossLoss6.96%Software - Infrastructure
EVTCEvertec
34.1400.820+2.46%292.97K9.95M33.11033.32034.19533.1102.19B2.17B64.03M63.46M+3.96%+1.88%-7.15%+5.28%+4.61%-10.59%-1.00%0.59%0.46%19.7319.733.26%Software - Infrastructure
FLYWFlywire
9.3000.220+2.42%1.85M17.26M9.1109.0809.4259.0861.15B1.04B123.59M111.43M+7.14%+7.51%-2.11%-51.89%-46.67%-54.99%-54.90%--1.66%465.00465.003.73%Software - Infrastructure
PYPLPayPal
66.3201.390+2.14%19.71M1.29B66.37064.93067.43064.36064.93B64.73B979.00M976.08M+7.98%+6.50%+1.64%-25.13%-14.15%-1.00%-22.30%--2.02%14.9016.624.73%Credit Services
JKHYJack Henry & Associates
173.5103.460+2.03%660.02K113.85M170.080170.050173.510169.38512.65B12.55B72.90M72.36M+0.48%-0.20%-4.98%-0.01%-4.61%+5.80%-0.70%1.27%0.91%31.2633.182.43%Information Technology Services
IMXIInternational Money Express
12.6700.230+1.85%188.09K2.37M12.42012.44012.68012.385388.36M336.76M30.65M26.58M+2.43%+6.38%+0.40%-33.00%-27.77%-39.61%-39.17%--0.71%7.087.082.37%Software - Infrastructure
PAGSPagSeguro Digital
10.0300.130+1.31%4.67M46.90M9.9209.90010.1359.9103.05B1.49B303.82M148.22M+7.27%+18.28%+31.45%+34.63%+24.44%-20.71%+60.22%--3.15%8.518.512.27%Software - Infrastructure
GDOTGreen Dot
8.3500.100+1.21%341.99K2.85M8.2708.2508.4108.170458.19M341.77M54.87M40.93M+6.37%+10.16%-1.07%-5.86%-25.91%-6.91%-21.52%--0.84%LossLoss2.91%Credit Services
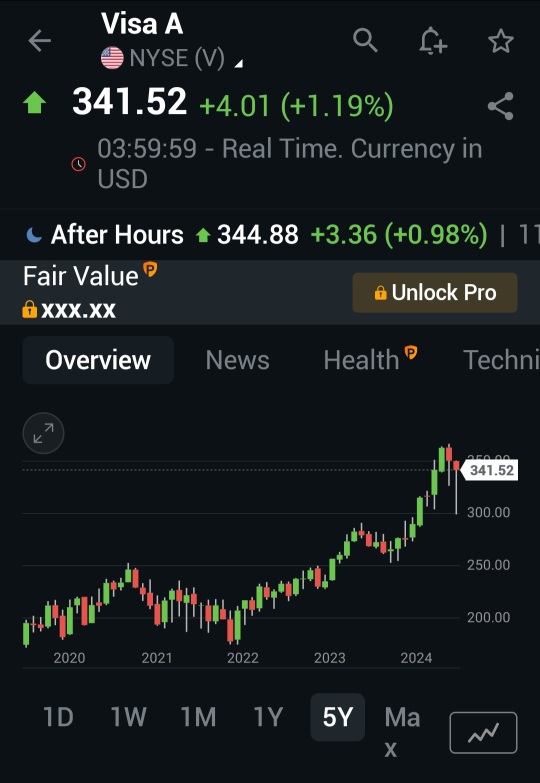
VVisa
341.5204.010+1.19%5.52M1.88B338.500337.510342.270336.460667.19B626.27B1.95B1.83B+3.05%+1.89%-2.55%+0.09%+17.89%+26.57%+8.24%0.63%0.30%34.3235.101.72%Credit Services
WEXWEX Inc
131.7501.280+0.98%447.88K59.03M131.380130.470132.635130.2055.11B4.48B38.82M34.03M+6.23%+3.19%-16.09%-28.35%-24.19%-39.76%-24.85%--1.32%17.5717.571.86%Software - Infrastructure
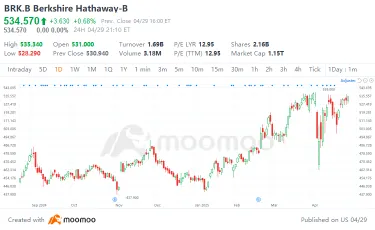
MAMasterCard
539.6805.190+0.97%2.04M1.10B534.340534.490540.480533.410492.03B487.71B911.71M903.69M+2.34%+5.31%-1.38%-2.68%+6.54%+18.76%+2.80%0.49%0.23%38.8538.851.32%Credit Services
AXPAmerican Express
267.0202.070+0.78%1.73M460.53M265.430264.950267.475261.830187.07B147.20B700.59M551.27M+5.78%+4.56%-0.43%-15.61%-1.52%+13.03%-9.52%1.09%0.31%18.6519.062.13%Credit Services
BFHBread Financial
48.4400.290+0.60%701.92K33.84M48.04048.15048.76047.1002.25B2.23B46.50M46.08M+3.31%+7.72%-3.27%-23.25%-3.89%+29.57%-20.40%1.73%1.52%8.708.823.45%Credit Services
ADYEYAdyen N.V. Unsponsored ADR
16.5200.060+0.36%333.45K5.50M16.55016.46016.60016.35052.03B52.03B3.15B3.15B+1.98%+3.64%+8.19%+2.80%+8.47%+34.31%+12.69%--0.01%49.0249.021.52%--
DLODLocal
9.0600.010+0.11%852.89K7.77M9.0809.0509.1889.0302.59B609.29M285.48M67.25M+1.46%+4.38%+8.63%-31.36%+7.86%-37.73%-19.54%--1.27%23.2323.231.75%Software - Infrastructure
WUThe Western Union
10.110-0.050-0.49%10.96M111.11M10.14010.16010.22010.1003.34B3.32B330.53M328.88M+1.10%+2.64%-4.44%+0.17%-1.59%-18.65%-2.48%9.30%3.33%3.763.691.18%Credit Services
STNEStoneCo
14.080-0.150-1.05%4.59M65.11M14.24014.23014.35014.0503.82B3.12B271.54M221.84M+7.32%+19.73%+34.35%+53.54%+27.08%-13.03%+76.66%--2.07%LossLoss2.11%Software - Infrastructure


![[29 Apr] Despite Volatile Trading Market Closed Positively](https://sgsnsimg.moomoo.com/sns_client_feed/101760671/20250430/2fcac6fc31ba259ea9878e23b74bb86a.png/thumb?area=101&is_public=true)
![[29 Apr] Despite Volatile Trading Market Closed Positively](https://sgsnsimg.moomoo.com/sns_client_feed/101760671/20250430/f46e379eb781db7b6a4d129175e69a5c.png/thumb?area=101&is_public=true)
![[29 Apr] Despite Volatile Trading Market Closed Positively](https://sgsnsimg.moomoo.com/sns_client_feed/101760671/20250430/e1c73ded1a37d32e5bfc262ea16f4a52.png/thumb?area=101&is_public=true)