


US OptionsDetailed Quotes
STLA250502P4500
- 0.00
- 0.000.00%
15min DelayClose May 1 09:30 ET
0.00High0.00Low
0.00Open0.00Pre Close0 Volume0 Open Interest4.50Strike Price0.00Turnover0.00%IV52.43%PremiumMay 2, 2025Expiry Date0.00Intrinsic Value100Multiplier1DDays to Expiry0.00Extrinsic Value100Contract SizeAmericanOptions Type--Delta--Gamma47.30Leverage Ratio--Theta--Rho--Eff Leverage--Vega
Stellantis NV Stock Discussion
Sign in to post a comment

Stocks held higher ground in overnight trading despite clear evidence of slowing growth in the world’s two major economies. Weaker US growth and slumping manufacturing in China had little impact as investors appeared to focus on a drop in inflation and the potential for the US Federal Reserve to reduce interest rates.
US GDP contracted in the first quarter of 2025 by 0.3%, well below forecasts of growth at 0.3%. Less than two ...
US GDP contracted in the first quarter of 2025 by 0.3%, well below forecasts of growth at 0.3%. Less than two ...
3
2

$Stellantis NV (STLA.US)$ can someone explain why the prices are different on Yahoo finance(or marketwatch) vs. Moomoo, comparing the past 5days. I’ve never seen the weird case before.

$Stellantis NV (STLA.US)$ May I check you have recd your Dividen ex on 23rd April?
$Stellantis NV (STLA.US)$ I bought on 22nd April. Am I still entitle the Dividen ex on 23rd April?
2

$Stellantis NV (STLA.US)$
Is it a Buy now?
Is it a Buy now?
1

$Stellantis NV (STLA.US)$ i sold at pre market , still eligible for dividend?
9

The S&P 500, Nasdaq Composite and Dow-30 all inched up less than 1% Monday after Apple and other tech giants rose on word that U.S. President Donald Trump had temporarily suspended tariffs on foreign-built tech items like smart phones.
The $S&P 500 Index (.SPX.US)$ led the way higher in percentage terms, gaining 42.61 points (0.8%) to 5,405.97, while the $Dow Jones Industrial Average (.DJI.US)$ rose 312.08 points (0.8%) t...
The $S&P 500 Index (.SPX.US)$ led the way higher in percentage terms, gaining 42.61 points (0.8%) to 5,405.97, while the $Dow Jones Industrial Average (.DJI.US)$ rose 312.08 points (0.8%) t...

12
3
Morning Movers
Gapping Up
$MSP Recovery (MSPR.US)$ shares surged 125% after the company announced a strategic term sheet aimed at enhancing liquidity and restructuring current agreements. This move will eliminate over $1.2 billion in corporate guaranteed debt and includes new agreements designed to propel future growth.
$JPMorgan (JPM.US)$ climbed 3.8% in premarket trading on Friday after the bank reported a quarterly profit increa...
 Expand
 17
2
5


$Stellantis NV (STLA.US)$
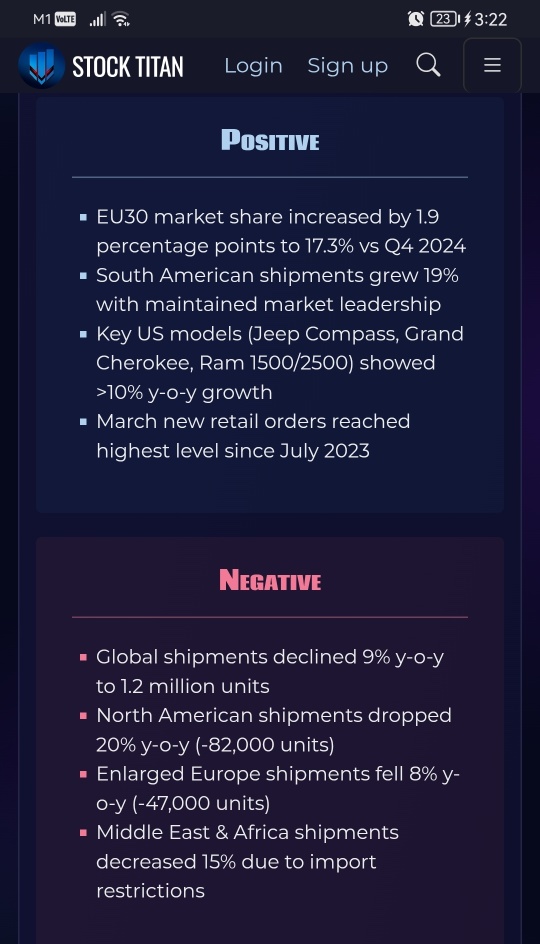
Stellantis Q1 Results: Global Shipments Fall 9% as North America Takes 20% Hit - Market Share Gains Offer Hope
Stellantis Q1 Results: Global Shipments Fall 9% as North America Takes 20% Hit - Market Share Gains Offer Hope
1
The Nasdaq Composite, S&P 500 and Dow industrials all shed 2.5% or more Thursday as stocks gave back part of the historic gains that followed President Trump's decision Wednesday for a 90-day tariff pause.
The $Nasdaq Composite Index (.IXIC.US)$ led the way downward Thursday, sinking 737.66 points (4.3%) to a 16,387.31 close.
Meanwhile, the $S&P 500 Index (.SPX.US)$ gave up 188.85 ticks (3.4%) to...
The $Nasdaq Composite Index (.IXIC.US)$ led the way downward Thursday, sinking 737.66 points (4.3%) to a 16,387.31 close.
Meanwhile, the $S&P 500 Index (.SPX.US)$ gave up 188.85 ticks (3.4%) to...
17
4
6
No comment yet
Space Dust : Good Day Sir,
Sir,
I have a weird idea that someone of your stature may be able to shed light on, and provide some sort of navigation buoy in this deep, thick mist we are in.
Is there some sort of way to conceptualize or visualize how inverse/short ETFS have, in a very positive way, possibly skewed downturns:
1. under the surface was worse once these are factored out.
2. a metric to know if we are in the calm, eye of the storm, or what
3. In the 'old days' of corrections, money just EVAPORATED, noone was really buying as much so this led to bigger losses.
4. Now, retail piles into short ETFs so in a way, that NASDAQ only went down 15% instead of typically 30%. Money into the markets, as a ballast against the selling.
5. If this hair brained idea held water, then human nature needs to know. Many would feel differently and some would be more at ease, that a "huge" loss has passed over. Clear skies ahead .
meaning, instead of a 25% drawdown post tariff. it was more like 37% had retail not piled into inverse ETFs.
Many would feel less skittish maybe if some type of " without inverse " overlay was applied to charts?
as a recovering contrarian bottom fisherman like me, at least.
Michael McCarthy CEO OP Space Dust : Fascinating idea. Certainly could be a contributor. The biggest market moves are due to surprise - a sudden change in the outlook. Part of that has to do with underlying "facts", and part of it is due to the interpretation of those facts. This may mean that the availability of short instruments has more participants considering the downside, meaning downside surprises have less impact and are therefore shallower.